
UI Components with d3.js
Today, we're going to look at doing something different with d3js. Most of the material online is geared towards creating visualizations with this amazing library, which is great, but it isn't the only thing we can use it for!
Before going heads in with the code, let's take a higher level look at what we'll be building.
For one of my projects, I had to build an 'Evidence Shoebox'; a place to put objects (named entities in the project) in various Evidence Boxes. I won't get into the details about what the project would acomplish but here is what is required of the Evidence Box.
The Evidence Box should have:
-
a header
- a title
- a count of the entities within it
- an option to close/expand the body to save space
-
a body
- the entities should be visible
Okay, that's simple enough. Before we actually go ahead I'd like to sketch this 'Evidence Box' out, so that we're are both clear on what it should like. I find that doing this makes my life easier since I have a good idea of the final product;
And....voila!

Here's what I'd like the component to look like. I've gone ahead and annoted the sketch so don't mistake that as part of the UI! Interestingly, you'd might want to extend the project by giving the user an option to view something similar for say, a tutorial.
// our reusable chart named EvidenceBox
function EvidenceBox(){
  // default component values
  var width  = 200,
      height = 250;

  // our main function that the outsidecontext interacts with
  function component(selection){
      selection.each(function(d, i){

      });
  }

  // setter and getter methods for our component values
  component.width = function(value){
    if(!arguments.length) return width;
    width = value;
    return component;
  }

  component.height = function(value){
    if(!arguments.length) return height;
    height = value;
    return component;
  }

  return component;
}
Looks like our usual reusable charts except that I've changed the name to component since that's what the UI element is!
First step - build the outline
function component(selection){
  selection.each(function(d, i){
    // get the div of the current selection
    var box = d3.select(this);

    // setup box size
    box.style({
      width: width+'px',
      height: height+'px'
    });

    // setup the outline
    box.style('border', '2px solid black');
  })
}
Great! Let's see if this actually works - write the following code after our EvidenceBox factory function.
var eb = EvidenceBox();

var container = d3.select('#canvas');
container
  .append('div')
  .attr('class', 'evidence')
  .call(eb);
You'll need an index.html file with the required dependencies; d3.js and app.js
Bring up your webserver and you should be greeted with the following empty box with a border!
Let's add a header to our box.
function EvidenceBox(){
var width = 200,
height = 250,
// default height of the header
headerHeight = 50,
headerColor = '#4A90E2',
entityColor = '#F5A623';
function component(selection){
selection.each(function(d, i){
// get the div of the current selection
var box = d3.select(this);
// setup box size
box.style({
width: width+'px',
height: height+'px'
});
// setup the outline
box.style('border', '2px solid black');
var header = box
.selectAll('.header')
.data([d]);
header
.enter()
.append('div')
.attr('class', 'header');
header.style({
height: headerHeight+'px',
'background-color': headerColor
});
})
}
.
.
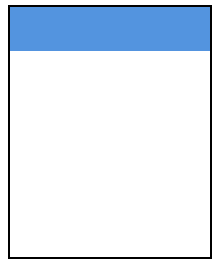
}Awesome! This is what you should have now.
Hmmmm. Where's the data? Let's throw in some.
var data = [
  {
    title: 'Evidence 2',
    entities: [
      'Casino',
      'Craps',
      'Loaded Dice'
    ]
  }
]
And modify our selection as follows
var eb = EvidenceBox();
var data = [
  {
    title: 'Evidence 2',
    entities: [
      'Casino',
      'Craps',
      'Loaded Dice'
    ]
  }
]
var container = d3.select('#chart');
container
  .selectAll('.evidence')
  .data(data)
  .enter()
  .append('div')
  .attr('class', 'evidence')
  .call(eb);
Nothing on the visual front should have changed but we now have some data bound to our UI! We're going to make use of the 'title' attribute in our data by placing it in the header.
.
.
header.style({
  height: headerHeight+'px',
  'background-color': headerColor
});

var headerText = header
                  .selectAll('.header-text')
                  .data([d]);

headerText
  .enter()
  .append('span')
  .attr('class', 'header-text')

headerText
  .style({
    'line-height', headerHeight+'px',
    color: 'white'
  })
  .text(function(d){ return d.title });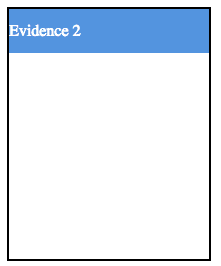
This component is already looking good. Let's add some of our entities to the body of the evidences.
.
.

headerText
  .style({
    'line-height': headerHeight+'px',
    color: 'white'
  })
  .text(function(d){ return d.title });

var body = box
            .selectAll('.body')
            .data(data);

body
  .enter()
  .append('div')
  .attr('class', 'body');

var entities = body
                .selectAll('.entity')
                .data(d.entities);

entities
  .enter()
  .append('div')
  .attr('class', 'entity');

entities
  .style('margin', '15px');

entities.each(function(entityData){
  var entityText = d3.select(this)
                    .selectAll('.entity-text')
                    .data([entityData]);
  entityText
    .enter()
    .append('span')
    .attr('class', 'entity-text');

  entityText
    .style({
      'background-color': entityColor,
      'padding': '5px'
    })
    .text(function(d) { return d; });
});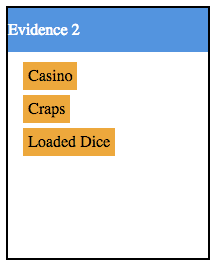
Now that we have our entities, we're going to show the count in the header.
.
.
headerText
  .style({
    'line-height': headerHeight+'px',
    color: 'white'
  })
  .text(function(d){ return d.title });

var entityCount = header
                    .selectAll('.entity-count')
                    .data([d]);

entityCount
  .enter()
  .append('div')
  .attr('class', 'entity-count');

entityCount
  .style({
    display: 'inline-block',
    'background-color': '#4A4A4A',
    color: 'white',
    float: 'right',
    margin: '10px 10px',
    'line-height': '24px',
    width: headerHeight/2 + 'px',
    'text-align': 'center'
  })
  .text(function(d){ return d.entities.length; });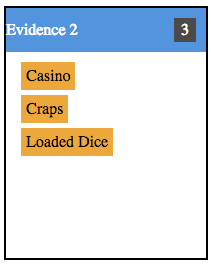
Hang in there! We're almost done! We're going to add the open/close functionality and we'd have a pretty useful component!
Let's start by including the font-awesome collection:
In your index.html file, include the font-awesome css file.
<link href="/font-awesome/css/font-awesome.min.css" rel'stylesheet' type="text/css'
Add the follwing code above the previous listing. We do this because we're using the 'float: right;' property on both elements and we want the open/close icon to be at the right most part of the header. If we instead wrote it after the previous listing, we'd have the element on the left of the entity count.
var openClose = header
                    .selectAll('.open-close')
                    .data([d]);

openClose
  .enter()
  .append('i')
  .classed({
    'open-close': true,
    'fa': true
  })
  .attr('data-is-open', 'true');


openClose
  .style({
    float: 'right',
    margin: '10px 10px',
  })
  .classed('fa-minus', function(d){
    var isOpen = d3.select(this).attr('data-is-open');
    if(isOpen === 'true'){ return true; }
    return false;
  })
  .classed('fa-plus', function(d){
    var isOpen = d3.select(this).attr('data-is-open');
    if(isOpen === 'true'){ return false; }
    return true;
  });
Note in the above listing, we're adding a data-is-open custom attribute and setting it to the default value of true. We'll use this attribute to show/hide the body. Your evidence box should look like the following listing:
I hope you can see the light at the end of the tunnel. We're going to add open/close functionality.
Add the following to the openClose variable above
openClose
    .style({
      float: 'right',
      margin: '10px 10px',
    })
    .classed('fa-minus', function(d){
      var isOpen = d3.select(this).attr('data-is-open');
      if(isOpen === 'true'){ return true; }
      return false;
    })
    .classed('fa-plus', function(d){
      var isOpen = d3.select(this).attr('data-is-open');
      if(isOpen === 'true'){ return false; }
      return true;
    })
    .on('click', function(d){
      var self = d3.select(this);
      var isOpen = self.attr('data-is-open');
      if(isOpen === 'true'){
        self.attr('data-is-open', 'false');
        self.attr('class', 'open-close fa fa-plus');
        body.style('display', 'none');
      }
      else {
        self.attr('data-is-open', 'true')
        self.attr('class', 'open-close fa fa-minus');
        body.style('display', '');
      }
    });
We also need to remove the 'height' property from the 'box' object to ensure that the body collapses.
// setup box size
box.style({
width: width+'px',
});
// setup the outline
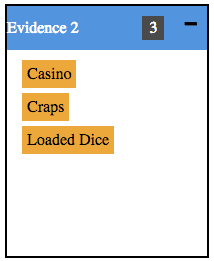
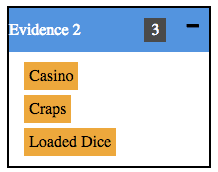
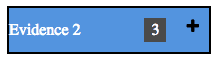
box.style('border', '2px solid black');And you're done! Good job getting this far! Clicking on the open/close button should show/hide the div like this:
Change the container code to do the following. It's going to update the component with the new data!
var evidences = container
                  .selectAll('.evidence')
                  .data(data);
evidences
  .enter()
  .append('div')
  .attr('class', 'evidence')
  .call(eb);


setTimeout(function(){
  data[0] = {
    title: 'Evidence Changed',
    entities: [
      'Casino',
      'Loaded Dice',
      'Blackjack'
    ]
  };

  evidences.data(data).call(eb);
}, 2000);
d3js is a powerful tool for creating resuable components, not just data visualizations and I hope that this introduction will have you using it in your own work!
Until next time...